

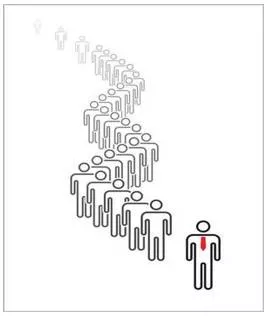
The shape of the jobs crisis
India has no industrial policy or employment strategy to ride the wave of its demographic dividend.Job creation has slowed since 2011-12, the year of the last published National Sample Survey Office (NSSO) labour force survey. I used Labour Bureau annual survey (2015-16) data and Centre for Monitoring Indian Economy Pvt. Ltd. (CMIE) data (post-2016), which has a sample size larger than the NSSO labour force surveys, to reach this conclusion. Both surveys cover rural and urban, and organised and unorganised sector employment; in other words, they capture both the Employees’ Provident Fund Organisation/National Pension Scheme (organised) as well as such employment as might be generated by Micro Units Development & Refinance Agency Ltd (MUDRA) loans or platform economy jobs. The latter two job sources are precisely what the government claims were not being captured by jobs data available. We have repeatedly stated that government claims on absence of ‘good’ data on jobs are simply untenable.
My analysis prior to the leak of NSSO 2017-18 data had shown that the jobs situation has turned grim since 2012.
A jump now
What the leaked NSSO 2017-18 data have shown is that while the open unemployment rate (which does not measure disguised unemployment and informal poor quality jobs that abound in the economy) by the usual status never went over 2.6% between 1977-78 and 2011-12, it has now jumped to 6.1% in 2017-18. This was expected. In the last 10-12 years, more young people have become educated. The tertiary education enrolment rate (for those in the 18-23 age group) rose from 11% in 2006 to 26% in 2016. The gross secondary (classes 9-10) enrolment rate for those in the 15-16 age groupshot up from 58% in 2010 to 90% in 2016. The expectation of such youth is for a urban, regular job in either industry or services, not in agriculture. If they have the financial wherewithal to obtain education up to such levels, they can also “afford” to remain unemployed. Poor people, who are also much more poorly educated, have a much lower capacity to withstand open unemployment, and hence have lower open unemployment rates.
What NSSO 2017-18 also shows is that as open unemployment rates increased, more and more people got disheartened and fell out of the labour force; in other words, they stopped looking for work. The result is that labour force participation rates (LFPR, i.e. those looking for work) for all ages, fell sharply from 43% in 2004-5 to 39.5% in 2011-12, to 36.9% in 2017-18 (a reflection mainly though not only of the falling female LFPR). This shows up in the growing numbers of youth who are NEETs: not in education, employment or training. They are a potential source of both our demographic dividend but also what is looking to be a mounting demographic disaster.
Meanwhile, government economists have repeatedly told us that there is no jobs crisis.
Between 2004-05 and 2011-12, as many as 7.5 million new non-agricultural jobs were being created every year. The unemployment rate was only 2.2%. The volume of open unemployment was almost constant (at around 10 million) until 2011-12, but it increased to 16.5 million by 2015-16. Increased open unemployment, post 2011-12, suggests that those in education prior to 2011-12 would start searching for non-agricultural jobs but did not find them. The latest NSSO data suggest that this situation had worsened further by 2017-18.
Across education categories
A sharp increase in the unemployment rate of the educated (based on our estimates of the Annual Survey, Labour Bureau) should have worried the government. My estimate is that the unemployment rate rose over 2011-12 to 2016 from 0.6% to 2.4% for those with middle education (class 8); 1.3% to 3.2% for those who had passed class 10; 2% to 4.4% for those who had passed class 12; 4.1% to 8.4% for graduates; and 5.3% to 8.5% for post-graduates. Even more worrying, for those with technical education, the unemployment rate rose for graduates from 6.9% to 11%, for post-graduates from 5.7% to 7.7%, and for the vocationally trained from 4.9% to 7.9%.
While NSSO 2017-18 data show the share of regular wage jobs rising, especially in urban areas (and the share of self-employed and casual wage work falling), this rise in nowhere close to the number of educated youth entering the labour force.
For an economy at India’s stage of development, an increase of workers in agriculture (of 20 million that took place over 1999-2004) is a structural retrogression, in a direction opposite to the desired one. Between 2004-5 and 2011-12, the number of workers in agriculture fell sharply, which is good, for the first time in India’s economic history. Similarly, the number of youth (15-29 years) employed in agriculture fell from 86.8 million to 60.9 million (or at the rate of 3 million per annum) between 2004-5 and 2011-12. However, after 2012, as non-agricultural job growth slowed, the number of youth in agriculture actually increased to 84.8 million till 2015-16 and even more since then (as the CMIE data would attest). These youth were better educated than the earlier cohort, but were forced to be in agriculture.
Drop in manufacturing jobs
Even worse, manufacturing jobs actually fell in absolute terms, from 58.9 million in 2011-12 to 48.3 million in 2015-16, a whopping 10.6 million over a four-year period. This is consistent with slowing growth in the Index of Industrial Production (IIP), which consists of manufacturing, mining, and electricity. The IIP had sharply risen from 100 in 2004-5 to 172 by 2013-14 (in the 2004-5 series), but only rose from a base of 100 in 2011-12 in the later series to 107 in 2013-14, and to 125.3 in 2017-18. This is also consistent with exports first falling after 2013, then barely recovering to levels still lower than 2013. It is also consistent with investment-to-GDP ratio falling sharply since 2013, and still remaining well below 2013 levels. This holds for both private and public investment.
What is tragic is the growing number of educated youth (15-29 years) who are “NEET”. This number (70 million in 2004-5) increased by 2 million per annum during 2004-5 and 2011-12, but grew by about 5 million per annum (2011-12 to 2015-16). If that later trend continued (as there is evidence it has) we estimate it would have increased to 115.6 million in 2017-18. That is a 32 million increase in “NEETs” in our society over 2011-12 to 2017-18 — potential lumpen fodder.
These youth (“NEET” and unemployed) together constitute the potential labour force, which can be utilised to realise the demographic dividend in India. Will a new government at least recognise there is a crisis?
I estimate that the number of new entrants into the labour force (currently at least 5 million per annum), and especially educated entrants into the labour force will go on increasing until 2030. It will thereafter still increase, though at a decelerating pace. By 2040 our demographic dividend — which comes but once in the lifetime of a nation — will be over. China managed to reduce poverty sharply by designing an employment strategy (underpinned by an education and skills policy) aligned to its industrial strategy. That is why it rode the wave of its demographic dividend. Unfortunately, India has neither an industrial policy nor an employment strategy, let alone the two being aligned.
Is our political class listening? Or are our educated unemployed and NEETs meant to be merely used as political fodder? That is the trillion rupee question for the fastest growing large economy in the world, about to become the fifth largest in the world.




Top court quashes FIRs against Gen Z protesters
Sep 04, 2026







Stay updated with The Hindu Editorial Vocab24 app, your definitive source for breaking news and comprehensive coverage from India and around the globe. Whether it's political developments, business updates, sports highlights, the latest technology trends, or current events, The Hindu brings live, accurate, and reliable news directly to your device.
Don’t fall for sensationalized or fake news shared online. Read and share accurate updates with friends and family through The Hindu Editorial Vocab24 app. Download it today!
News Coverage in The Hindu Editorial Vocab24 App
Breaking News: Receive instant notifications on breaking news stories as they unfold. Stay informed about major events and developments in India and around the world with live blogs, news in shorts videos, and concise articles.
Politics: Get the latest updates on Indian politics, including elections, policy changes, government decisions, and political events that shape the nation.
Business and Economy: Stay ahead in the economic landscape with detailed business news and market analysis. Learn about stock market trends, financial reports, corporate news, and economic developments to make informed investment decisions.
Current Events: Follow stories on social issues, policy changes, global events, and daily current affairs, tailored for UPSC and other competitive exam preparations.
Technology: Keep up with the latest gadgets, innovations, and tech trends. Read expert reviews and analyses in short, concise updates on cutting-edge technology from India and beyond.
Sports: Never miss a moment of your favorite sports. Get live scores, match reports, and expert analysis on cricket, football, tennis, and more.
International News: Stay informed about global events and geopolitical developments, including the Russia-Ukraine war, Israel-Palestine conflict, and other key international stories.
Local News: Stay connected to your community with the latest updates on city events, issues, and local news. Coverage includes hyperlocal updates from cities like Bangalore, Chennai, Delhi, Hyderabad, Mumbai, Kolkata, and more.
Trending Topics: Discover what's trending today with the most talked-about stories and hot topics across India and the world.
Experience journalism that values integrity, accuracy, and reliability. Download The Hindu Editorial Vocab24 app today and stay connected with the world.
Subscribe to our newsletter!